


MICRO DEGREE
Business Analytics
Become a professional Business Analyst in 16 weeks

100% LIVE Interactive Classes
Become a professional Business Analyst in 16 weeks
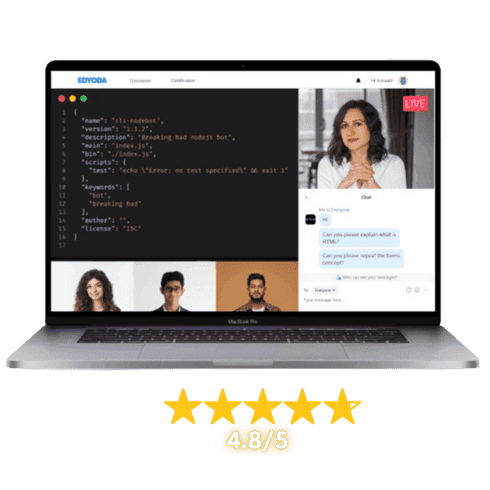
100% LIVE Interactive Classes
Reserve your spot today!
Basic Info
Select Offers
Application closes on:25 Jul 2026
Get instant access of pre-course material!
Talk to Us
We’re here to help! Reach us at:
What is in it for you?
 100% Live Classes
Instructor-led Live Sessions
Attend 4 weeks of instructor led live classes from the top 1% industry experts
Projects & Case Studies
Projects & Case Studies
Gain hands-on experience with projects and real-world case studies for impactful learning.
Verified Certificate
Verified Certificate
Earn a industry recognized certificate and kick start your career
Session Recordings
Session Recordings
Revisit older chapters anytime with recorded sessions
Flexible Schedule
Flexible Schedule
Choose live classes from different cohorts that fit your availability.
Hands-on Lab Access
Hands-on Lab Access
Students get access to labs to practice their learnings
![]() 100% Moneyback Guarantee
100% Moneyback Guarantee
Grab your slot before the offer expires
Reserve your spot today!
Basic Info
Select Offers
Application closes on:25 Jul 2026
Get instant access of pre-course material!
Talk to Us
We’re here to help! Reach us at:
Learn from Top 1%
Sr. Managers, VPs, CXOs, Directors & Founders from companies shaping the future.

Combo Offers
Create Your Own Combo
 100% Moneyback Guarantee
Available in 4 monthly installments at $105/month
Reserve your spot today!
Curriculum
Duration: 8 weeks
Max Batch Size: 15 persons
Live Sessions Schedule ![]() Sat - Sun (Weekends Only)
Sat - Sun (Weekends Only) ![]() Timing 7:00 AM - 9:00 AM / 8:30 AM - 10:30 AM / 11:00 AM - 1:00 PM / 5:00 PM - 7:00 PM / 7:30 PM - 9:30 PM EST
Timing 7:00 AM - 9:00 AM / 8:30 AM - 10:30 AM / 11:00 AM - 1:00 PM / 5:00 PM - 7:00 PM / 7:30 PM - 9:30 PM EST
- Introduction to Business Intelligence (BI)
- BI Architecture and Data Flow Concepts
- Overview of Power BI Ecosystem
- Power BI Components (Desktop, Service, Mobile, Gateway)
- Power BI Licensing and Pricing Models
- Power BI vs Tableau vs QlikView
Mentors

12+ Years, Sr Analyst Manager, Tiger Analytics

15+ Years, Sr. Manager, Deloitte
Course Includes
LIVE Interactive Sessions
Quizzes, Assignments & Projects
Study Materials & Session Recordings
Lab Access
Certificate
Tools Covered

Course Includes
LIVE Interactive Sessions
Quizzes, Assignments & Projects
Study Materials & Session Recordings
Lab Access
Certificate
Course Pre-requisites
.ffb97545.png&w=16&q=75&dpl=dpl_9aeoL373EdV9XMhw9Y7Eqm7aWvV3) Basic understanding of business concepts and terminology
Basic understanding of business concepts and terminology- Familiarity with spreadsheet tools such as Microsoft Excel or Google Sheets
- No prior experience with Power BI, SQL, or Tableau required — the course covers fundamentals from the ground up
Outcomes
- Build interactive dashboards and reports using Power BI Desktop for business intelligence
- Design and implement data models using star schema and snowflake schema best practices
- Implement DAX calculations including time intelligence functions for advanced business metrics
- Write advanced SQL queries using joins, subqueries, window functions, and stored procedures for data extraction and analysis
- Create compelling visual analytics and data stories using Tableau
- Transform and clean raw data using Power Query for analysis-ready datasets
- Analyse business data to identify trends, patterns, and actionable insights for strategic decision-making
- Publish, share, and manage reports through Power BI Service with row-level security and scheduled refresh
Projects You Will Build
Practical, enterprise-grade projects that reflect real industry challenges
Retail Sales Performance Dashboard with Power BI
Build an end-to-end Power BI solution for a retail company by connecting to multiple data sources, transforming data with Power Query, and creating a star schema data model. Develop DAX measures for KPIs such as YTD revenue, profit margins, and cumulative growth, and design an interactive executive dashboard with drill-through capabilities.
Customer and Transaction Analytics with SQL
Design and query a relational database for a financial services company to analyse customer transactions, detect anomalies, and generate business reports. Leverage advanced SQL techniques including window functions, CTEs, stored procedures, and performance optimization to deliver actionable insights on customer segmentation and revenue trends.
Student Enrollment and Retention Analysis with Tableau
Analyse student enrollment, engagement, and retention data for an EdTech platform using Tableau. Create interactive visualizations including trend analyses, cohort comparisons, and geographic breakdowns to identify key drivers of student churn and recommend data-driven strategies to improve retention rates.

for successfully completing the 'Business Analytics' course conducted from 29 May 2026 to 24 Jul 2026
Add a Industry Recognized
Certificate To Your Resume
Industry Recognized
Certificate
Learn the best from the best

Career Advancements
Elevate your career with a respected certificate
Industry Respect
Gain credibility in the field
Networking
Connect with experts and peers
Opportunities
Attract exciting job prospects and promotions

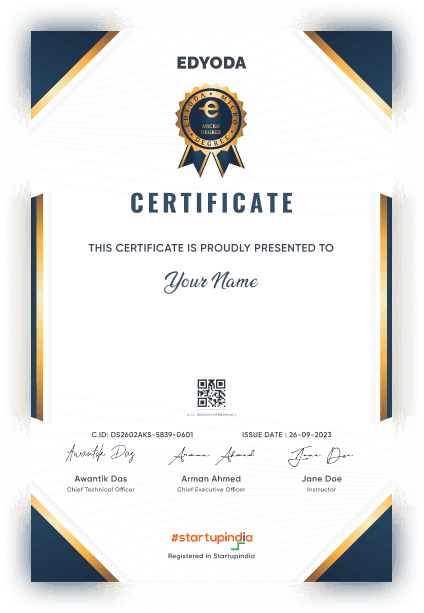
for successfully completing the 'Business Analytics' course conducted from 29 May 2026 to 24 Jul 2026

100% Moneyback Guarantee
Top 1% Recruiters - Get interview access to 550+ Companies

Frequently Asked Questions
Everything you need to know about the course
No prior experience with these tools is required. The course starts from the fundamentals of business intelligence and progressively builds to advanced topics. Basic familiarity with spreadsheets like Excel is helpful but not mandatory.
The course covers three major tools: Power BI (data extraction, Power Query transformations, data modeling, DAX calculations, report design, and Power BI Service), SQL (database design, advanced querying, joins, window functions, stored procedures, and optimization), and Tableau (visual analytics, dashboarding, calculated fields, and data storytelling). Together, these cover the full business analytics workflow.
The course is designed for 8 weeks and typically requires 10-15 hours per week, including video lectures, hands-on exercises, and project work. The structured weekly modules allow you to balance learning with professional commitments.
You will complete three industry-relevant projects: a Power BI retail sales performance dashboard with DAX measures and interactive visuals, a SQL-based customer and transaction analytics solution for a financial services company, and a Tableau-driven student enrollment and retention analysis for an EdTech platform. Each project simulates real-world business scenarios.
This course prepares you for in-demand roles such as Business Analyst, Data Analyst, Business Intelligence Analyst, Analytics Consultant, and Reporting Specialist. Proficiency in Power BI, SQL, and Tableau is among the most sought-after skill combinations in analytics job postings, and the hands-on projects provide portfolio-ready work to showcase to employers.
You will use Power BI Desktop (free download from Microsoft), SQL Server or Azure SQL for database work, and Tableau Desktop or Tableau Public for visual analytics. The course provides guidance on setting up all required tools and accessing necessary data sources at the start of the program.
The Micro Degree course is an online LIVE course, where LIVE sessions will be conducted online on our Classroom platform. Prior to the start of the course, you'll receive preparatory material in the form of recorded content which can be access on the same platform.
In this course instructors will use English language for teaching.
Upon successful registration, you will receive a confirmation email on your registered email ID. In this email you will receive login details for your newly created account on the Edyoda Classroom platform (https://classroom.edyoda.com). Additionally, you will receive a PDF guide containing step-by-step instructions on how to utilize the platform to access live sessions and learning materials.
Our instructors are the industry experts with a minimum working experience of 10 years with a strong technical and teaching background. They bring industry knowledge and practical expertise to the course.
Yes, the course includes online assignments, quizzes, and a final project to reinforce your learning and assess your proficiency in Business Analytics.
Yes, you can interact with instructors and fellow students through discussion forums, live Q&A sessions. We encourage a supportive learning community.
Yes, hands-on lab access is available at an additional cost, typically around ₹2,750 (or $30 for international learners) per year. This is the standard rate for most tracks, though specialized labs such as Data and Security may be priced differently. Beyond just practicing what you learn, the labs let you host and showcase your projects live, so you can share your work on social media or present it directly to recruiters as part of your portfolio.
We offer a 100% money-back guarantee to ensure your complete satisfaction. If you're not satisfied, you can request a full refund within 3 days of purchase or before the second session, whichever comes earlier. Simply contact our support team(support@edyoda.com) with your purchase details, such as the order ID or email address, and share your reason for the refund. Requests made after 3 days or after the second session will not be eligible for a refund. There are no hidden charges, you will receive the full amount paid. Refunds are processed within 7–10 business days and credited back to your original payment method.
Recommendations