


MICRO DEGREE
Data Analytics
Become a professional Data Analyst in 16 weeks

100% LIVE Interactive Classes
Become a professional Data Analyst in 16 weeks
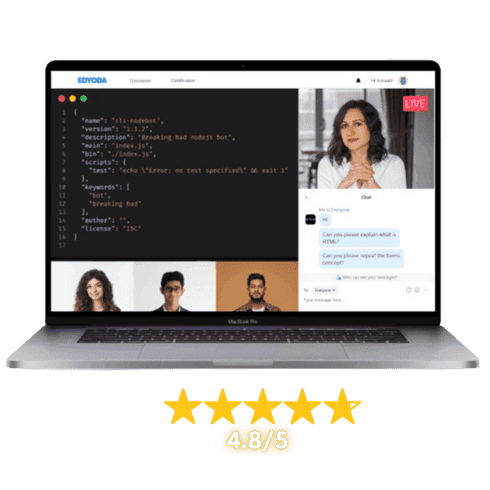
100% LIVE Interactive Classes
Reserve your spot today!
Basic Info
Select Offers
Application closes on:03 Aug 2026
Get instant access of pre-course material!
Talk to Us
We’re here to help! Reach us at:
What is in it for you?
 100% Live Classes
Instructor-led Live Sessions
Attend 4 weeks of instructor led live classes from the top 1% industry experts
Projects & Case Studies
Projects & Case Studies
Gain hands-on experience with projects and real-world case studies for impactful learning.
Verified Certificate
Verified Certificate
Earn a industry recognized certificate and kick start your career
Session Recordings
Session Recordings
Revisit older chapters anytime with recorded sessions
Flexible Schedule
Flexible Schedule
Choose live classes from different cohorts that fit your availability.
Hands-on Lab Access
Hands-on Lab Access
Students get access to labs to practice their learnings
![]() 100% Moneyback Guarantee
100% Moneyback Guarantee
Grab your slot before the offer expires
Reserve your spot today!
Basic Info
Select Offers
Application closes on:03 Aug 2026
Get instant access of pre-course material!
Talk to Us
We’re here to help! Reach us at:
Learn from Top 1%
Sr. Managers, VPs, CXOs, Directors & Founders from companies shaping the future.

Combo Offers
Create Your Own Combo
 100% Moneyback Guarantee
Available in 4 monthly installments at $105/month
Reserve your spot today!
Curriculum
Duration: 12 weeks
Max Batch Size: 15 persons
Live Sessions Schedule ![]() Sat - Sun (Weekends Only)
Sat - Sun (Weekends Only) ![]() Timing 7:00 AM - 9:00 AM / 8:30 AM - 10:30 AM / 11:00 AM - 1:00 PM / 5:00 PM - 7:00 PM / 7:30 PM - 9:30 PM EST
Timing 7:00 AM - 9:00 AM / 8:30 AM - 10:30 AM / 11:00 AM - 1:00 PM / 5:00 PM - 7:00 PM / 7:30 PM - 9:30 PM EST
- Introduction to Business Intelligence (BI)
- BI Architecture and Data Flow Concepts
- Overview of Power BI Ecosystem
- Power BI Components (Desktop, Service, Mobile, Gateway)
- Power BI Licensing and Pricing Models
- Power BI vs Tableau vs QlikView
Mentors

22+ Years, VP Engineering, Philips

12+ Years, Sr Analyst Manager, Tiger Analytics

15+ Years, Sr. Manager, Deloitte
Course Includes
LIVE Interactive Sessions
Quizzes, Assignments & Projects
Study Materials & Session Recordings
Lab Access
Certificate
Tools Covered

Course Includes
LIVE Interactive Sessions
Quizzes, Assignments & Projects
Study Materials & Session Recordings
Lab Access
Certificate
Course Pre-requisites
.ffb97545.png&w=16&q=75&dpl=dpl_9aeoL373EdV9XMhw9Y7Eqm7aWvV3) Basic understanding of data and business concepts
Basic understanding of data and business concepts- Familiarity with spreadsheets (Excel or Google Sheets) and basic data manipulation
- No prior programming experience required; Python and SQL fundamentals are taught from scratch
Outcomes
- Build interactive dashboards and reports using Power BI Desktop and Power BI Service
- Design optimized data models using Star Schema and Snowflake Schema principles
- Implement DAX calculations including time intelligence, ranking, and cumulative totals
- Perform data extraction, cleaning, and transformation using Power Query and Python Pandas
- Write SQL queries for data retrieval, aggregation, joins, and database management
- Apply advanced analytics techniques such as regression, forecasting, and A/B testing using Python
- Automate data pipelines and integrate data from multiple sources including databases, APIs, and files
- Communicate data-driven insights effectively through visualization best practices and storytelling
Projects You Will Build
Practical, enterprise-grade projects that reflect real industry challenges
Retail Sales Analytics Dashboard
Build an end-to-end Power BI dashboard for an e-commerce retailer by connecting to SQL databases and CSV files, transforming data with Power Query, and modeling a star schema. Create DAX measures for KPIs like year-over-year growth, customer segmentation, and product performance with drill-through reports and interactive slicers.
HR Workforce Analytics with Python and SQL
Extract and clean employee data from a relational database using SQL and Python Pandas to analyze attrition patterns, compensation trends, and department performance. Apply regression and statistical analysis to identify key drivers of employee turnover and present findings in a comprehensive Power BI report.
Financial Performance Reporting and Forecasting
Design a data pipeline that consolidates financial data from multiple Excel files and a SQL Server database, applies Power Query transformations, and builds a robust data model with DAX time intelligence measures. Use Python for time-series forecasting and deliver an executive Power BI dashboard with YTD, QTD, and MTD comparisons alongside predictive trend analysis.

for successfully completing the 'Data Analytics' course conducted from 10 May 2026 to 02 Aug 2026
Add a Industry Recognized
Certificate To Your Resume
Industry Recognized
Certificate
Learn the best from the best

Career Advancements
Elevate your career with a respected certificate
Industry Respect
Gain credibility in the field
Networking
Connect with experts and peers
Opportunities
Attract exciting job prospects and promotions

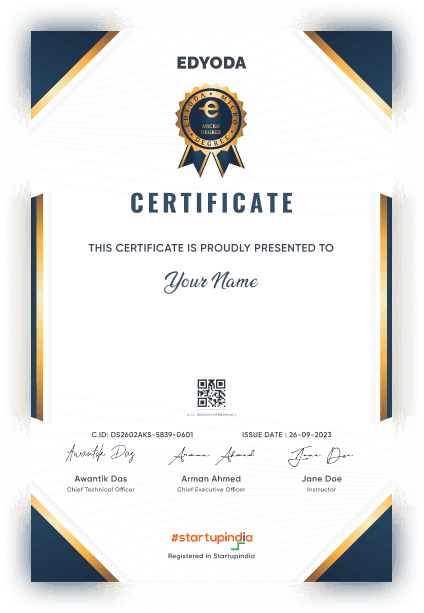
for successfully completing the 'Data Analytics' course conducted from 10 May 2026 to 02 Aug 2026

100% Moneyback Guarantee
Top 1% Recruiters - Get interview access to 550+ Companies

Frequently Asked Questions
Everything you need to know about the course
No prior programming experience is required. The course teaches Python and SQL fundamentals from scratch. However, basic familiarity with spreadsheets and general business concepts will help you progress more quickly through the early modules.
The 12-week curriculum covers Power BI (data extraction, Power Query transformations, data modeling, DAX calculations, visualization, and publishing), Python (Pandas, data manipulation, statistical analysis, regression, forecasting), and SQL (queries, joins, subqueries, database design, and optimization). You'll also learn business intelligence architecture, advanced analytics, and data storytelling.
You should plan for approximately 10-15 hours per week, which includes video lectures, hands-on labs, practice exercises, and project work. The 12-week structure allows you to progressively build skills across Power BI, Python, and SQL without being overwhelming.
You will complete three industry-relevant capstone projects spanning retail analytics, workforce analytics, and financial reporting. Throughout the course, you'll also work on weekly hands-on labs including building Power BI dashboards, writing SQL queries against real databases, and performing data analysis with Python and Pandas.
Graduates will be prepared for roles such as Data Analyst, Business Intelligence Analyst, Analytics Consultant, and Data Engineer. The combination of Power BI, Python, and SQL skills is among the most in-demand in the analytics job market, and the portfolio of projects you build will demonstrate practical, job-ready capabilities to employers.
You will work extensively with Power BI Desktop and Power BI Service for business intelligence and visualization, Python with libraries like Pandas and Matplotlib for data analysis, and SQL Server for database querying and management. You'll also use Power Query for data transformation and Jupyter Notebooks for Python-based analytics.
The Micro Degree course is an online LIVE course, where LIVE sessions will be conducted online on our Classroom platform. Prior to the start of the course, you'll receive preparatory material in the form of recorded content which can be access on the same platform.
In this course instructors will use English language for teaching.
Upon successful registration, you will receive a confirmation email on your registered email ID. In this email you will receive login details for your newly created account on the Edyoda Classroom platform (https://classroom.edyoda.com). Additionally, you will receive a PDF guide containing step-by-step instructions on how to utilize the platform to access live sessions and learning materials.
Our instructors are the industry experts with a minimum working experience of 10 years with a strong technical and teaching background. They bring industry knowledge and practical expertise to the course.
Yes, the course includes online assignments, quizzes, and a final project to reinforce your learning and assess your proficiency in Data Analytics.
Yes, you can interact with instructors and fellow students through discussion forums, live Q&A sessions. We encourage a supportive learning community.
Yes, hands-on lab access is available at an additional cost, typically around ₹2,750 (or $30 for international learners) per year. This is the standard rate for most tracks, though specialized labs such as Data and Security may be priced differently. Beyond just practicing what you learn, the labs let you host and showcase your projects live, so you can share your work on social media or present it directly to recruiters as part of your portfolio.
We offer a 100% money-back guarantee to ensure your complete satisfaction. If you're not satisfied, you can request a full refund within 3 days of purchase or before the second session, whichever comes earlier. Simply contact our support team(support@edyoda.com) with your purchase details, such as the order ID or email address, and share your reason for the refund. Requests made after 3 days or after the second session will not be eligible for a refund. There are no hidden charges, you will receive the full amount paid. Refunds are processed within 7–10 business days and credited back to your original payment method.
Recommendations