




MICRO DEGREE
Data Analysis Using Python
Become an expert in Data Analysis using Python in just 5 weeks

100% LIVE Interactive Classes
Become an expert in Data Analysis using Python in just 5 weeks
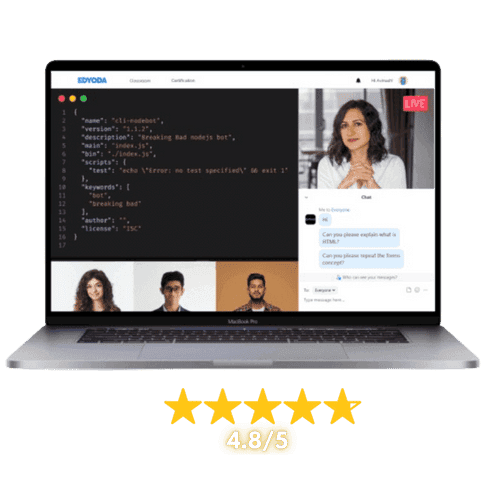
100% LIVE Interactive Classes

Reserve your spot today!
Basic Info
Select Offers
Application closes on:21 Sep 2026
Get instant access of pre-course material!
Talk to Us
We’re here to help! Reach us at:
What is in it for you?

 100% Live Classes
Instructor-led Live Sessions
Attend 4 weeks of instructor led live classes from the top 1% industry experts


Projects & Case Studies
Projects & Case Studies
Gain hands-on experience with projects and real-world case studies for impactful learning.

Verified Certificate
Verified Certificate
Earn a industry recognized certificate and kick start your career

Session Recordings
Session Recordings
Revisit older chapters anytime with recorded sessions

Flexible Schedule
Flexible Schedule
Choose live classes from different cohorts that fit your availability.

Hands-on Lab Access
Hands-on Lab Access
Students get access to labs to practice their learnings
 100% Moneyback Guarantee
Grab your slot before the offer expires
Reserve your spot today!
Basic Info
Select Offers
Application closes on:21 Sep 2026
Get instant access of pre-course material!
Talk to Us
We’re here to help! Reach us at:
Learn from Top 1%
Sr. Managers, VPs, CXOs, Directors & Founders from companies shaping the future.

Combo Offers
Create Your Own Combo
100% Moneyback Guarantee
Available in 4 monthly installments at $61/month
Reserve your spot today!
Curriculum
Duration: 5 weeks
Max Batch Size: 15 persons
Live Sessions Schedule  Sat - Sun (Weekends Only)
  Timing 7:00 AM - 9:00 AM / 8:30 AM - 10:30 AM / 11:00 AM - 1:00 PM / 5:00 PM - 7:00 PM / 7:30 PM - 9:30 PM EST

- Introduction to Data Analysis: Lifecycle, Tools & Real-World Applications
- NumPy Arrays: Creation, Indexing, Slicing & Broadcasting
- Mathematical Operations & Statistical Functions with NumPy
- Array Manipulation: Reshaping, Stacking, Splitting & Transposing
- Performance Optimization: Vectorization vs Loops
- Hands-on: Financial Data Analysis - Calculate Returns, Moving Averages & Portfolio Statistics
Mentors

10+ Years, Tech Leader, Tiger Analytics


12+ Years, Sr Analyst Manager, Tiger Analytics

Course Includes

LIVE Interactive Sessions

Quizzes, Assignments & Projects

Study Materials & Session Recordings

Lab Access

Certificate
Tools Covered

Course Includes
LIVE Interactive Sessions
Quizzes, Assignments & Projects
Study Materials & Session Recordings
Lab Access
Certificate
Course Pre-requisites
.ffb97545.png&w=16&q=75&dpl=dpl_BJQV2wM6H5Pn4HiECmWzzEAEuUxx) Basic Python programming (variables, loops, functions, data structures)
Basic Python programming (variables, loops, functions, data structures)- Familiarity with basic mathematics and statistics concepts
- Understanding of spreadsheet-based data handling (e.g., Excel or Google Sheets)
Outcomes
- Build efficient numerical computations using NumPy arrays, vectorization, and statistical functions
- Analyse and transform structured datasets using Pandas Series and DataFrames
- Implement data wrangling workflows including merging, grouping, pivoting, and handling missing data
- Design time series analyses with resampling, rolling windows, and lag feature engineering
- Create compelling data visualizations using Matplotlib and Seaborn to communicate insights
- Implement exploratory data analysis (EDA) techniques to uncover patterns and validate business hypotheses
- Build regression and time series forecasting models for predictive analytics
- Optimise data processing performance through memory management, chunking, and vectorized operations
Projects You Will Build
Practical, enterprise-grade projects that reflect real industry challenges
Financial Portfolio Analysis with NumPy
Analyse historical financial data to calculate portfolio returns, moving averages, and risk statistics using NumPy. Apply vectorized operations and statistical functions to compare asset performance and generate portfolio optimization recommendations.
E-commerce Sales Analytics & Reporting
Clean, transform, and merge multi-source e-commerce datasets using Pandas to build a comprehensive sales analysis pipeline. Perform GroupBy aggregations, pivot table summaries, and create visualizations with Matplotlib and Seaborn to identify top products, customer segments, and revenue trends.
Stock Market Time Series Forecasting
Process historical stock market data with time series techniques including resampling, rolling windows, and lag feature engineering. Build regression-based forecasting models to predict future price trends and present findings through polished visualizations and statistical summaries.

for successfully completing the 'Data Analysis Using Python' course conducted from 16 Aug 2026 to 20 Sep 2026
Add a Industry Recognized
Certificate To Your Resume
Industry Recognized
Certificate
Learn the best from the best

Career Advancements
Elevate your career with a respected certificate
Industry Respect
Gain credibility in the field
Networking
Connect with experts and peers
Opportunities
Attract exciting job prospects and promotions

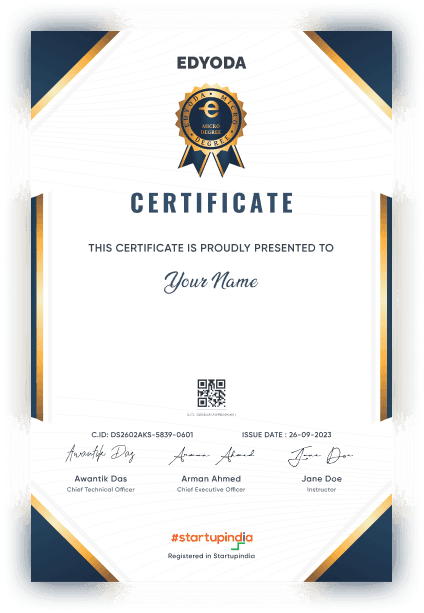
for successfully completing the 'Data Analysis Using Python' course conducted from 16 Aug 2026 to 20 Sep 2026

100% Moneyback Guarantee
Top 1% Recruiters - Get interview access to 550+ Companies

Frequently Asked Questions
Everything you need to know about the course
You should have a basic understanding of Python programming, including variables, loops, functions, and data structures. No prior data analysis or data science experience is required, but familiarity with basic math and statistics concepts will be helpful.
The course covers the full data analysis lifecycle using Python. You'll master NumPy for numerical computing, Pandas for data wrangling and transformation, Matplotlib and Seaborn for visualization, and explore time series analysis, statistical modeling, regression, and performance optimization techniques.
The course runs for 5 weeks and includes live interactive classes and hands-on projects. You should plan to dedicate approximately 8-10 hours per week, including class time, project work, and practice exercises to get the most out of the curriculum.
You'll work on industry-relevant projects including financial portfolio analysis with NumPy, e-commerce sales data cleaning and reporting with Pandas, customer database integration from multiple sources, time series stock market analysis, and building predictive models — all using real-world datasets.
This course prepares you for roles such as Data Analyst, Business Intelligence Analyst, and aspiring Data Scientist. You'll build a portfolio of hands-on projects demonstrating your ability to wrangle, analyze, visualize, and model data — key skills that employers actively seek in the data analytics job market.
You will work extensively with Python, NumPy, Pandas, Matplotlib, and Seaborn. You'll also learn to read data from multiple sources including CSV, Excel, JSON, SQL databases, and APIs, and apply performance optimization techniques for handling large datasets.
The Micro Degree course is an online LIVE course, where LIVE sessions will be conducted online on our Classroom platform. Prior to the start of the course, you'll receive preparatory material in the form of recorded content which can be access on the same platform.
In this course instructors will use English language for teaching.
Upon successful registration, you will receive a confirmation email on your registered email ID. In this email you will receive login details for your newly created account on the Edyoda Classroom platform (https://classroom.edyoda.com). Additionally, you will receive a PDF guide containing step-by-step instructions on how to utilize the platform to access live sessions and learning materials.
Our instructors are the industry experts with a minimum working experience of 10 years with a strong technical and teaching background. They bring industry knowledge and practical expertise to the course.
Yes, the course includes online assignments, quizzes, and a final project to reinforce your learning and assess your proficiency in Data Analysis Using Python.
Yes, you can interact with instructors and fellow students through discussion forums, live Q&A sessions. We encourage a supportive learning community.
Yes, hands-on lab access is available at an additional cost, typically around ₹2,750 (or $30 for international learners) per year. This is the standard rate for most tracks, though specialized labs such as Data and Security may be priced differently. Beyond just practicing what you learn, the labs let you host and showcase your projects live, so you can share your work on social media or present it directly to recruiters as part of your portfolio.
We offer a 100% money-back guarantee to ensure your complete satisfaction. If you're not satisfied, you can request a full refund within 3 days of purchase or before the second session, whichever comes earlier. Simply contact our support team(support@edyoda.com) with your purchase details, such as the order ID or email address, and share your reason for the refund. Requests made after 3 days or after the second session will not be eligible for a refund. There are no hidden charges, you will receive the full amount paid. Refunds are processed within 7–10 business days and credited back to your original payment method.
Recommendations




